ANOVA
Statistics & ProbabilityWhere this fitsContinues from Chi-Square Tests. A two-sample t-test compares the means of two groups. ANOVA generalizes this to three or more groups. This note first introduces the F-distribution it relies on, then covers one-way ANOVA.
The F-distribution
Just as the chi-square distribution is related to the normal, the F-distribution is related to the chi-square.
If you take two independent chi-square distributions and divide each by its degrees of freedom, then take their ratio, you get an F-distribution:
Key properties:
- It is a continuous probability distribution.
- Values are non-negative (it is a ratio of non-negative quantities), starting at 0.
- It is positively skewed (right tail).
- It has two parameters: the numerator degrees of freedom and the denominator degrees of freedom.
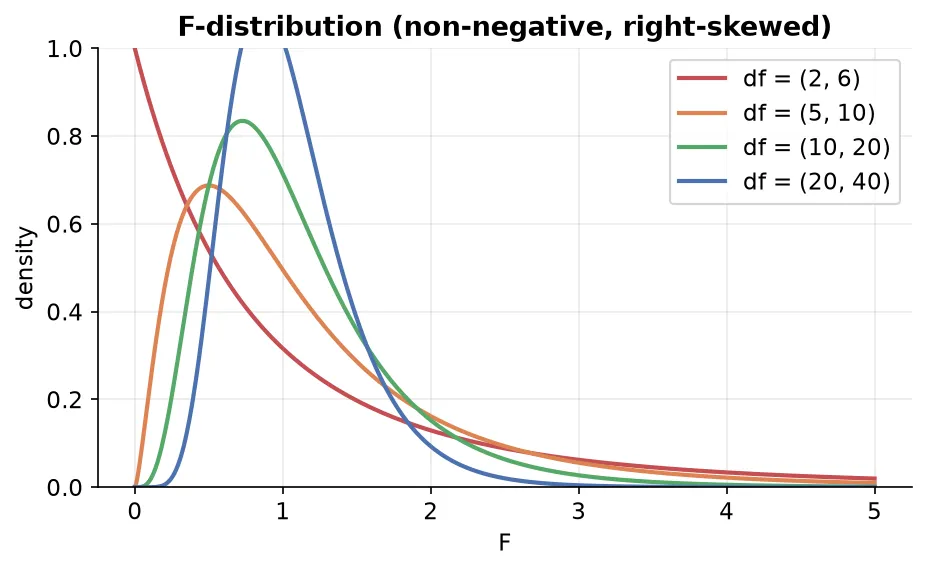
It is used whenever we compare variances, which is exactly what ANOVA does.
Why ANOVA (and not many t-tests)?
A two-sample t-test only handles two groups. If a categorical column has three or more categories (e.g. three sections of a class), you want to compare all their means at once.
Don’t just run many t-testsYou could run a t-test on every pair (A-B, B-C, C-A), but each test carries a Type I error rate of . Doing several inflates the overall (family-wise) error. For 3 groups, the chance of at least one false positive rises from 5% to about 15%. ANOVA tests all groups together in one test, keeping the error controlled.
One-way ANOVA
Compares the means of three or more independent groups to see if any differ significantly. “One-way” means the groups are split by a single factor.
The hypotheses
- : all group means are equal ().
- : at least one group mean is significantly different from the others.
The deeper nullReally, assumes all groups are drawn from the same population, so of course their means would match. We try to gather evidence against that.
The mechanics: partitioning variance
ANOVA’s core idea: the total variance in the combined data comes from two sources.
| Term | Name | What it measures |
|---|---|---|
| SST | Sum of Squares Total | overall variance: each point vs the grand mean |
| SSB | Sum of Squares Between groups | how far each group mean is from the grand mean (weighted by group size) |
| SSW | Sum of Squares Within groups | variance inside each group (each point vs its own group mean), summed |
The grand mean is the mean of all data points combined.
Formulas
Sanity checkalways holds. If your SSB and SSW don’t add up to SST, there is a calculation error.
Degrees of freedom
Let = total data points and = number of groups.
| Source | Degrees of freedom |
|---|---|
| Between (SSB) | |
| Within (SSW) | |
| Total (SST) |
The F-statistic
This ratio follows the F-distribution (because SSB and SSW each behave like chi-square quantities). Once you have , compute its p-value from the F-distribution and compare to .
Interpreting F
- Large F happens when SSB is large (group means are far from the grand mean) relative to SSW. That is strong evidence the groups differ, so the p-value is small and we reject .
- F near 0 happens when the group means are all close to the grand mean (SSB small). Then we fail to reject ; the groups look like one population.
   large SSB  → group means spread far apart → large F → small p → reject H0
   small SSB  → group means bunched together → small F → large p → keep H0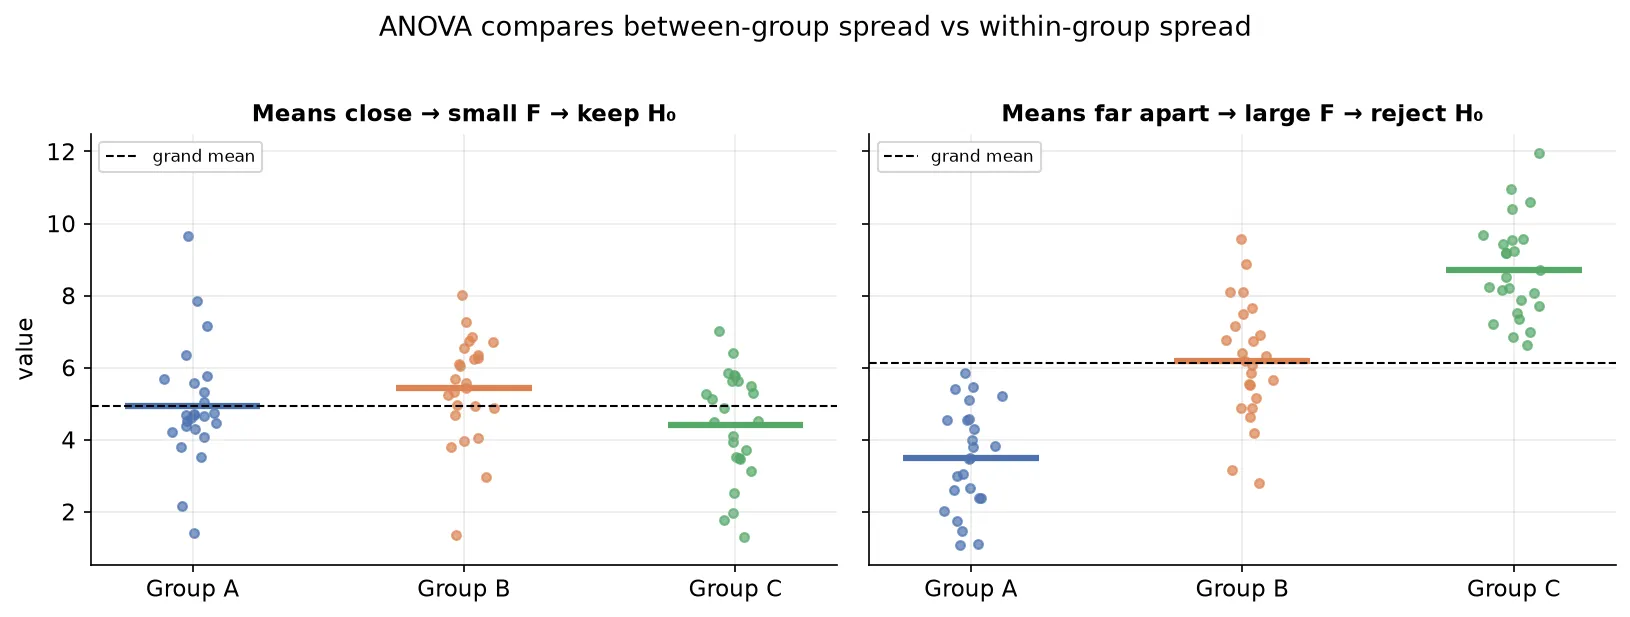
Titanic (age across Pclass)Split ages into three groups by
Pclass(1, 2, 3) and ask whether their mean ages are equal.
scipy.stats.f_oneway(age_class1, age_class2, age_class3)returns the F-statistic and p-value.- The p-value came out ≈ 0, so reject : mean age is not the same across passenger classes.
Assumptions of one-way ANOVA
- Independence of observations across groups.
- Normality: data within each group is approximately normal (or per group via the CLT).
- Equal variances across groups (check with Levene’s test). If violated, use Welch’s ANOVA instead.
Post-hoc tests
ANOVA only tells you that at least one group differs; it does not say which one. To find the culprit, run a post-hoc test after a significant ANOVA.
| Post-hoc approach | Idea |
|---|---|
| Pairwise t-tests with Bonferroni correction | run a t-test on each pair, but shrink by dividing by the number of comparisons to control the inflated family-wise error |
| Tukey’s HSD | compares all pairs at once and reports which pairs differ, with confidence intervals |
Bonferroni correctionIf you make comparisons, use as the threshold for each. This counteracts the family-wise error inflation described earlier, keeping the overall error near the intended 5%.
Where ANOVA is used in ML
| Use case | How |
|---|---|
| Feature selection | test whether a numerical feature’s mean differs across target classes |
| Model comparison | compare performance across several models/settings |
| Hyperparameter tuning | compare results across parameter combinations |
Summary
- The F-distribution is a ratio of two chi-square quantities (each divided by its degrees of freedom); it is non-negative, right-skewed, and has two df parameters.
- One-way ANOVA compares the means of 3+ independent groups in a single test, avoiding the inflated error of many t-tests.
- It partitions variance: (total = between + within).
- The F-statistic ; a large F (big between-group spread) gives a small p-value → reject .
- Assumptions: independence, normality per group, and equal variances (Levene’s test).
- A significant ANOVA needs a post-hoc test (Tukey’s HSD, or Bonferroni-corrected pairwise t-tests) to find which groups differ.