Non-Gaussian Distributions and Transformations
Prerequisites: Skewness, Kurtosis and Normality Checks
Where this fitsContinues from Skewness, Kurtosis and Normality Checks. Once you know a column isn’t normal, you have two options: model it with a different distribution, or reshape it toward normal. This note covers the common non-Gaussian continuous distributions (uniform, log-normal, Pareto) and the mathematical transformations used to normalize data for distribution-sensitive algorithms.
Non-Gaussian continuous distributions
Real-world data is often not normal. Three very common non-Gaussian continuous distributions:
1. Uniform distribution
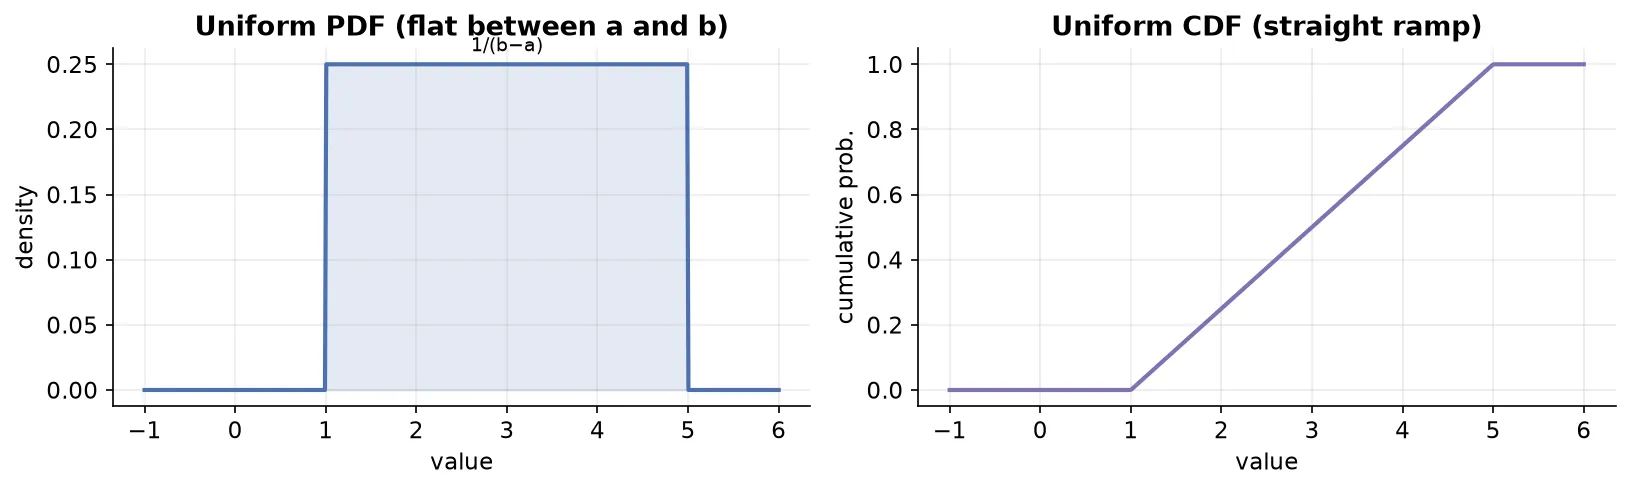
Every outcome in a range is equally likely. A fair die is the discrete version (each face has probability 1/6, so all bars are the same height).
Continuous uniform is denoted , where a is the lower bound and b the upper bound of the range.
- PDF: constant between
aandb, zero elsewhere. Because the total area must be 1 and the width is : - CDF: 0 below
a, rises steadily, and reaches 1 atb. - Skewness = 0 (it is symmetric, like the normal).
Where it appears in machine learning (usually behind the scenes):
| Use case | Role of uniform distribution |
|---|---|
| Random initialization | starting parameters in neural networks and k-means are drawn uniformly, so all values in a range are equally likely |
| Sampling | randomly selecting a representative subset (e.g. train/test split) |
| Random number generation | pseudo-random generators rely on it |
| Data augmentation | adding controlled randomness to create new data (e.g. zoomed/shifted images in CNNs) |
| Hyperparameter tuning | randomly searching parameter combinations |
2. Log-normal distribution
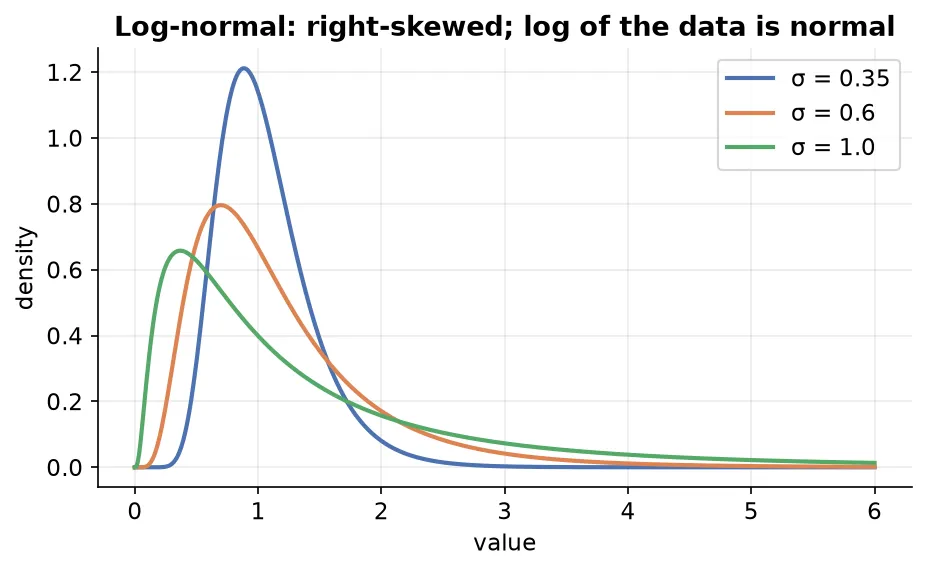
A heavy-tailed, right-skewed distribution whose logarithm is normally distributed.
ImportantNot every right-skewed distribution is log-normal. Only those where taking the log of the values produces a normal distribution qualify. If
Xis log-normal, thenln(X)is normal.
- Denoted , with the same two parameters as the normal (though they describe the log of the variable).
- The PDF is very similar to the normal’s, essentially the normal’s cousin.
Where it appears (extremely common in internet/social applications):
- Number of words in comments on YouTube, Reddit, Instagram, Facebook.
- Dwell time users spend on online articles.
- Length of online chess games.
- Distribution of wealth/income (many people earn little, few earn a lot).
The pattern: many observations cluster at low values, and a few stretch far out to the right.
How to check for log-normal: take the log of the data, then run a QQ plot (or normality check) on the transformed values. If the transformed data is normal, the original was log-normal.
3. Pareto distribution
A special case of a power law. A power law is a functional relationship where one variable is a power of another:
Its graph drops steeply then flattens into a long tail.
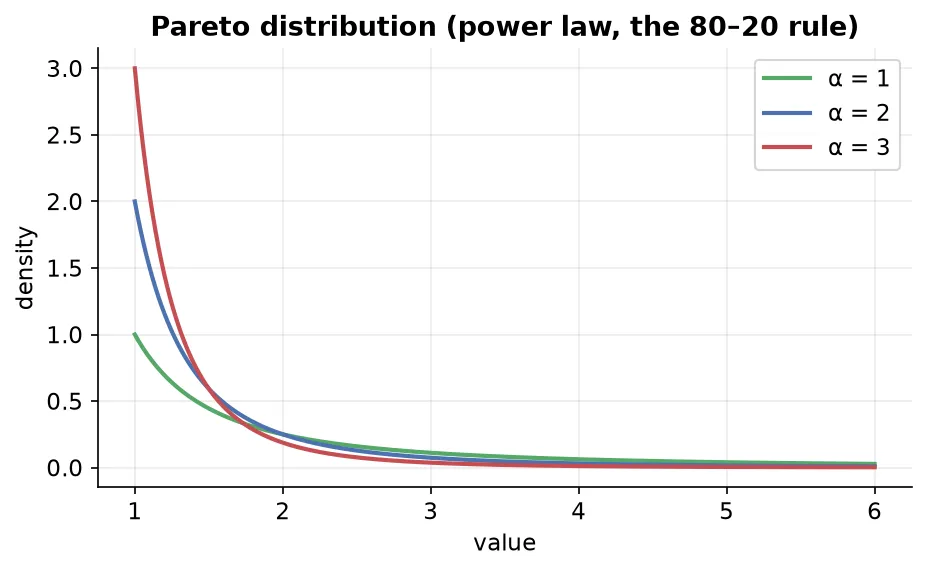
The 80-20 rule (Pareto principle): roughly 20% of causes account for 80% of effects.
ExampleVilfredo Pareto studied wealth and found that about 20% of people control about 80% of the wealth. This is the origin of the Pareto distribution.
- Single parameter (shape). A higher gives a higher, sharper peak and thinner tail; a lower gives a lower peak and fatter tail. As , the curve becomes a vertical line.
- PDF: , where is the minimum value.
- It is skewed (not symmetric).
NoteThe exact 80-20 split is not universal; it depends on . It is a rough guide, not a fixed law.
Where it appears: wealth/income distributions, city population vs area, file-size distribution of internet traffic (a few large files make up most of the total gigabytes).
How to detect Pareto: use a log-log plot (plot log(x) vs log(y)); a Pareto/power-law relationship shows up as a straight descending line. A QQ plot against a theoretical Pareto also works.
Mathematical transformations
Goal: convert a non-normal distribution into a (more) normal one, because several ML algorithms (linear regression, logistic regression, KNN) perform better on normally distributed data.
A transformation applies a mathematical function to a column to reshape its distribution.
NoteIt is not a strict rule that normal data always helps. Whether it improves results depends on the algorithm. Tree-based models like decision trees are unaffected by the distribution; linear models are affected.
In scikit-learn, transformations live in two classes:
              scikit-learn transformers
              /            |            \
     FunctionTransformer  PowerTransformer  QuantileTransformer
       (log, reciprocal,   (Box-Cox,          (rarely used)
        square, sqrt,       Yeo-Johnson)
        custom)
FunctionTransformer transforms
Apply any function you like via FunctionTransformer(func=...).
| Transform | Formula | Best for |
|---|---|---|
| Log | right-skewed data | |
| Reciprocal | reverses order (big↔small); situational | |
| Square | left-skewed data | |
| Square root | mildly right-skewed; try and check |
- Log transform is the go-to for right-skewed data. It pulls in large values and centers the distribution. On a log scale, distant points come closer and look more linear, helping linear models.
np.logfails on zeros/negatives. Usenp.log1p, which computes , so zeros are safe. If your data has no zeros, plain log is fine too.
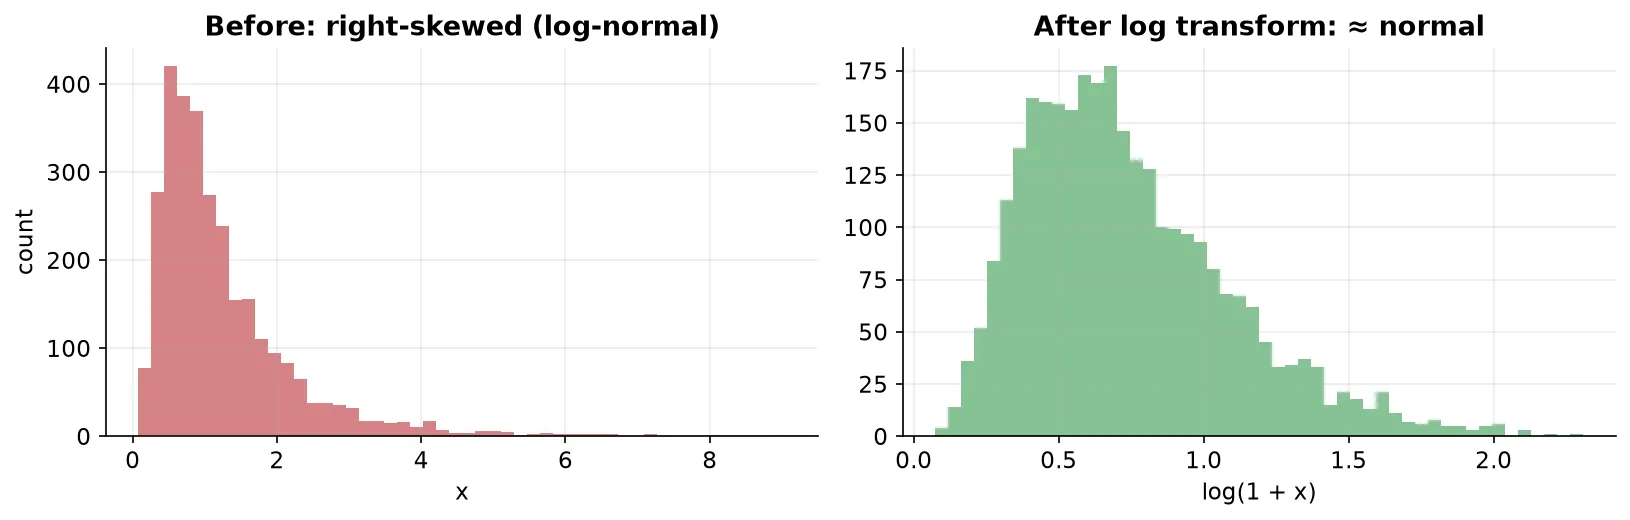
- There is no one-size-fits-all; try each transform and keep whichever gives the best result. You can even define a fully custom function (, a sine, etc.).
Titanic (Age + Fare → Survived)
Fareis right-skewed,Ageis roughly normal. Applying a log transform toFareand refitting logistic regression improved accuracy, while decision tree accuracy stayed the same (trees ignore distribution). Forcing a log transform on the near-normalAgeactually hurt results, so aColumnTransformerwas used to transform onlyFareand passAgethrough unchanged. Cross-validation confirmed the improvement was real.
PowerTransformer transforms
PowerTransformer finds the best power to raise data to (via a parameter , “lambda”) so the result is as normal as possible. Two methods:
| Method | Data requirement | Notes |
|---|---|---|
| Box-Cox | strictly positive (no zero, no negative) | classic; a small constant can be added to handle zeros |
| Yeo-Johnson | works with positive, zero, and negative data | default in scikit-learn; often the better performer |
- Internally, a lambda is estimated per column (using maximum likelihood), and each value is raised to that power to transform it.
- By default
PowerTransformeralso applies zero-mean, unit-variance standardization (standardize=True), so you usually do not need to scale separately. - Understanding what it does (map to a normal shape) is enough at this level; the deep how belongs to advanced (maximum likelihood / Bayesian) statistics.
Concrete strength datasetA regression problem with several non-normal input columns. Baseline linear regression gave an R² (cross-validated) around 0.46. Applying Box-Cox (with a tiny constant added to zero-valued columns) raised it to about 0.66. Applying Yeo-Johnson raised it further to about 0.68. Plotting each column before vs after showed most columns becoming much closer to normal (though bimodal columns cannot be fully fixed by a single transform).
Practical workflow: check which columns are non-normal, apply PowerTransformer (try both Box-Cox and Yeo-Johnson), compare via cross-validation, and keep whatever performs best. It is essentially parameter tuning.
Summary
- Common non-Gaussian distributions: uniform (equal likelihood over a range, skew 0), log-normal (right-skewed, its log is normal), and Pareto (a power law, the 80-20 rule).
- Detect them by transforming and re-checking normality (log for log-normal) or with tailored plots (log-log plot / QQ plot for Pareto).
- Transformations reshape non-normal data toward normal to help distribution-sensitive algorithms (linear/logistic regression, KNN); tree models are unaffected.
- FunctionTransformer applies log (right-skew), square (left-skew), reciprocal, sqrt, or custom functions; log is the workhorse (use
np.log1pfor zeros). - PowerTransformer estimates the best power automatically: Box-Cox (positive data only) and Yeo-Johnson (handles zero/negative, the usual default).
- There is no universal best transform, try several and validate with cross-validation.
Continues toThat completes the distributions arc. The story now shifts to two key discrete distributions in Bernoulli and Binomial Distributions, which open the door to inferential statistics.
Test yourself
Quiz me is a timed test of 8 questions drawn from a pool of 15 (~7 mins, score 6+ to complete the note; miss it and it locks until review). Each attempt is a fresh mix. Flashcards is untimed recall practice over the whole pool.
Completion
Score at least 6 of 8 on the quiz above to complete this note.
Private to you, stored in this browser, never uploaded.